The approach for game predictions changed starting with the games held in week 13. I now use game stastistics for each team and apply gradient boosted decision trees (GB), support vector regression (SVR),
partial least squared regression (PLSR), principle component Analysis (PCA), and random forest (RF) to predict a the winner, spread,
and total score.
The latest line from Draft Kings is provided as a comparison in the last column. The previous prediction models can be found
here . The results for those models can be found
For the college team rankings, I use java to read the results of each NCAA D1 college football match during the season from
collegefootballdata.com and then generate a rating and relative ranking of each team
using five different rating systems (Elo, Glicko 2, Beat Graph, Page Rank and HITS). A short description of each system and results from
previoous seasons can be found here
The team power ratings are calculated by standardizing a wide range of team metrics for all FBS teams. Approximately 25 total
metrics are used. Wins, losses and strength of schedule are not incorporated as a metric so a team's ratings should be taken
into context of their respective schedule.
Elo:
The Elo rating system is well known for its use in chess. Elo uses the existing rating of the competitors
and the result of the match to determine each competitor's new Elo rating. The Elo rating for each team starts
at 1500 at the beginning of the season with a global K-value of 80-100.
A more detailed description of the Elo rating system can be found here:
Elo Details
Glicko 2 (G2):
The Glicko 2 rating system is similar to the Elo system. The main difference is the inclusion of a ratings deviation
that gives an indication of the reliability of the rating. The rating deviation for each team starts at 350 but, as more games are played,
Glicko 2 gets more confident and that number will decrease. A more detailed description of this rating system can be found here:
Glicko 2 Details
PageRank (PR):
PageRank was originally developed by Google to rank websites but can be applied to sports as well. PageRank is a graph-based
rating system and the rating of a team is affected by how the strength of their opponents continues to evolve over the course of the
season after they have played them. A more detailed description of this rating system can be found here:
PageRank Details
BeatGraph (BG)
BeatGraph is my interpretation of the BeatGraph system. This is also a graph based rating system. BeatGraph is the only rating system
I use that purposefully destroys part of the game data in an attempt to create an acyclic graph. In college football this generally results in about 30-40%
of game data being thrown away. A more detailed description of this rating system can be found here:
BeatGraph Details
HITS:
Hyperlink-Induced Topic Search (HITS) was originally designed as a link analysis algorithm that rates web pages. I have modified the algorithm
to rate college football teams. A more detailed description of this rating system can be found here:
HITS Details
Summary of College Football Ranking Results
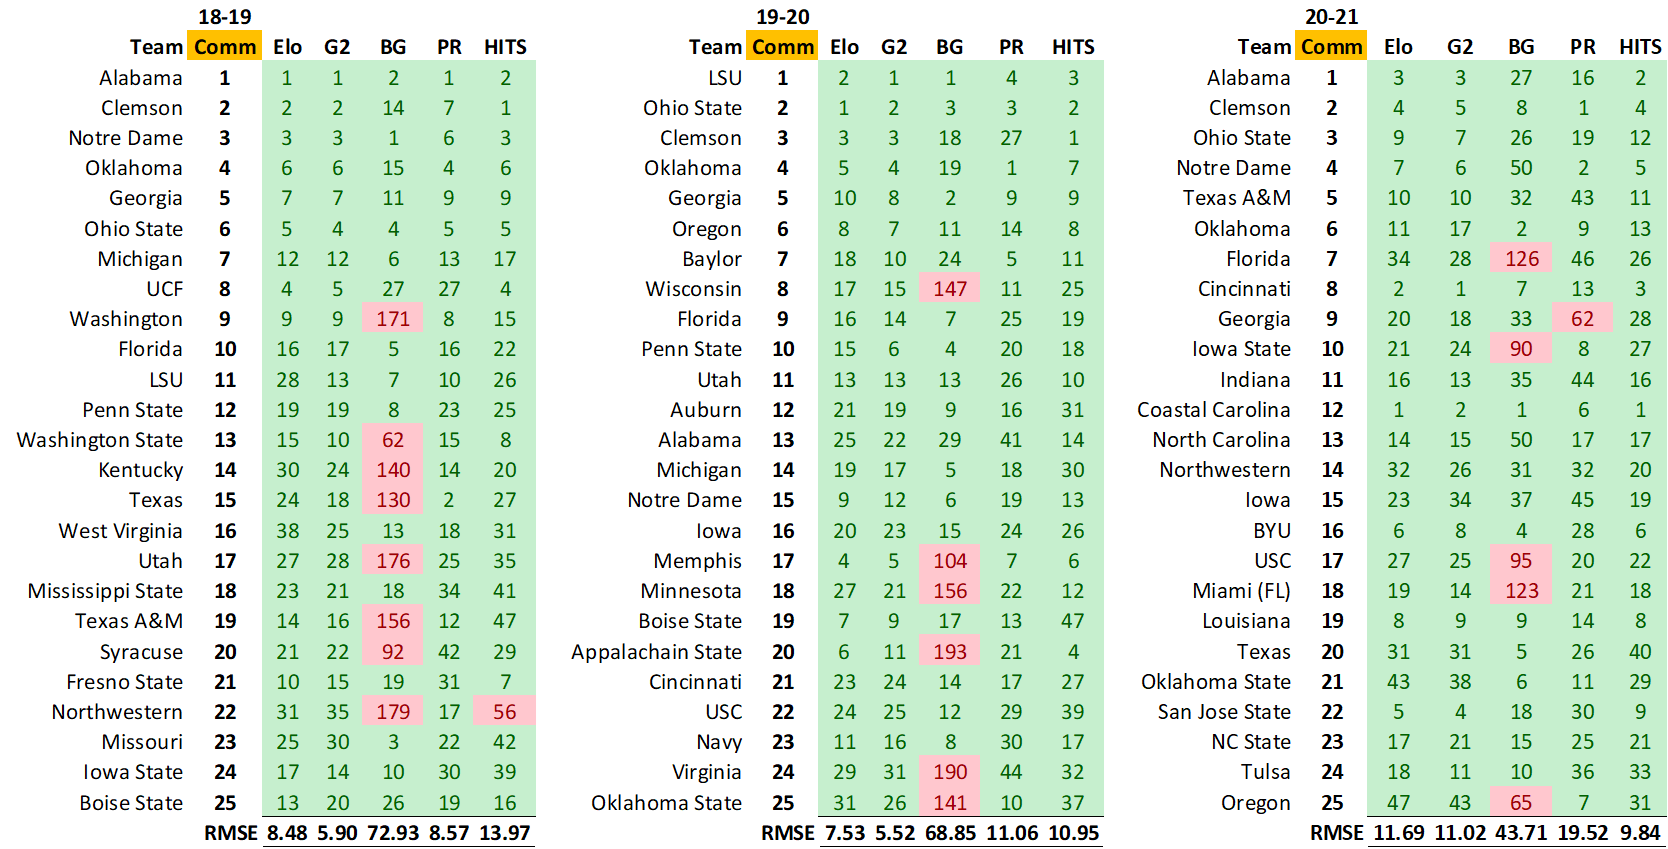
The Figure below summarizes the results for the college football D1 rankings for the
2018-19, 2019-20, and 2020-21 seasons. Each table in that figure includes the final regular season rankings from the CFP Selection Committee before the bowl games
and college playoffs begin (the column called "comm"). The other columns include the rank calculated using the different rating systems. Even though the CFB Selection Committee's
ranking is often hotly debated, we use it as the reference to calculate the Root Mean Square Error (RMSE) for each rating system at the end of each regular season.
This makes it easier to compare the results for each rating system. The green cells in the tables represent the teams in the committee's top 25 list that also were calculated
to be in the top 50 for the given rating system. The red cells represent teams in the committee's top 25 that were calculated to be outside the top 50 for the given rating system.
More details for each model for the last three seasons are provided in the next part of this section.
Figure 1: Summary of Ranking Results and RMSE for the Past Three Seasons
College Football Ranking Result Details
The 2018-2019 Season
The tables below show the rating results for each system at the conclusion of the 2018/2019 college football regular season. The RMSE numbers as calculated as previously described.
Although the program generates a rating and ranking for > 200 college Div. 1 football teams, only the top 25 from the committee and for each system are shown in the table.
Table 1: RMSE vs. Playoff Selection Committee Rankings for Each Model (2018-19)
Elo
Glicko 2
BG
PageRank
HITS
8.48
5.90
72.93
8.57
13.97
Table 2: College Football 2018-2019 Season (Regular Season Only)
#
Committee
Elo
Score
Glicko 2
Score
Dev.
BG
Score
PageRank
Score
HITS
Score
1
Alabama
Alabama
1925.18
Alabama
2161.95
131.46
Notre Dame
126
Alabama
152.75
Clemson
162.16
2
Clemson
Clemson
1909.07
Clemson
2157.07
134.17
Alabama
122
Texas
148.79
Alabama
162.16
3
Notre Dame
Notre Dame
1870.76
Notre Dame
2125.53
143.24
Missouri
119
Purdue
125.3
Notre Dame
149.68
4
Oklahoma
UCF
1862.96
Ohio State
2063.49
127.03
Ohio State
117
Oklahoma
122.38
UCF
149.68
5
Georgia
Ohio State
1855.51
UCF
2061.22
138.09
Florida
114
Ohio State
108.77
Ohio State
138.82
6
Ohio State
Oklahoma
1839.6
Oklahoma
2033.27
121.67
Michigan
111
Notre Dame
106.97
Oklahoma
133.4
7
Michigan
Georgia
1802.81
Georgia
2027.38
122.44
LSU
108
Clemson
106.58
Fresno State
108.26
8
UCF
Appalachian State
1775.73
Army
1925.73
145.99
Penn State
101
Washington
104.67
Washington State
97.6
9
Washington
Washington
1770.9
Washington
1923.4
119.18
Iowa
95
Georgia
103.47
Georgia
97.4
10
Florida
Fresno State
1769.11
Washington State
1915.12
129.93
Iowa State
80
LSU
88.16
Utah State
93.98
11
LSU
Army
1759.09
Appalachian State
1910.38
127
Georgia
76
Oklahoma State
81.49
Appalachian State
92.17
12
Penn State
Michigan
1740.43
Michigan
1904.79
124.27
Miami
75
Texas A&M
79.56
Army
90.36
13
Washington State
Boise State
1734.23
LSU
1903.65
128.16
West Virginia
74
Michigan
72.46
Cincinnati
88.55
14
Kentucky
Texas A&M
1722.77
Iowa State
1899.84
129.59
Clemson
73
Kentucky
71.85
UAB
86.74
15
Texas
Washington State
1716.87
Fresno State
1898.11
122.53
Oklahoma
72
Washington State
70.68
Washington
84.93
16
West Virginia
Florida
1713.1
Texas A&M
1892.62
119.87
Vanderbilt
72
Florida
68.77
Boise State
81.31
17
Utah
Iowa State
1710.86
Florida
1887.07
121.33
Army
70
Northwestern
66.8
Michigan
81.31
18
Mississippi State
Temple
1700.04
Texas
1886.08
117.08
Mississippi State
67
West Virginia
65.31
Buffalo
77.69
19
Texas A&M
Penn State
1698.28
Penn State
1876.27
122.63
Fresno State
66
Boise State
65.26
North Texas
74.26
20
Syracuse
Cincinnati
1696.46
Boise State
1872.5
115.79
North Texas
61
Auburn
65.2
Kentucky
68.83
21
Fresno State
Syracuse
1692.3
Mississippi State
1870.99
123.79
Tennessee
60
Michigan State
62.85
Troy
65.21
22
Northwestern
Utah State
1690.99
Syracuse
1866.59
130.03
Indiana
59
Missouri
62.14
Florida
61.6
23
Missouri
Mississippi State
1685.12
Cincinnati
1866.32
134.94
NC State
59
Penn State
61.79
Georgia Southern
61.6
24
Iowa State
Texas
1682.47
Kentucky
1861.73
127.31
Virginia Tech
52
Minnesota
61.39
NC State
61.6
25
Boise State
Missouri
1679.81
West Virginia
1847.07
129.18
Auburn
52
Utah
59.54
Penn State
59.79
The 2019-2020 Season
The tables below show the rating results for each system at the conclusion of the 2019/2020 college football regular season. The RMSE numbers as calculated as previously described.
Although the program generates a rating and ranking for > 200 college Div. 1 football teams, only the top 25 from the committee and for each system are shown in the table.
Table 3: RMSE vs. Playoff Selection Committee Rankings for Each Model (2019-20)
Elo
Glicko 2
BG
PageRank
HITS
7.53
5.52
68.85
11.06
10.95
Table 4: College Football 2019-2020 Season (Regular Season Only)
#
Committee
Elo
Score
Glicko 2
Score
Dev.
BG
Score
PageRank
Score
HITS
Score
1
LSU
Ohio State
1930.35
LSU
2177.13
133.3
LSU
170
Oklahoma
439.33
Clemson
160.53
2
Ohio State
LSU
1927.1
Ohio State
2175.98
128.11
Georgia
167
Kansas State
416.42
Ohio State
160.53
3
Clemson
Clemson
1884.14
Clemson
2098.62
135.25
Ohio State
163
Ohio State
247.38
LSU
160.53
4
Oklahoma
Memphis
1883.75
Oklahoma
2081.14
119.68
Penn State
160
LSU
218.44
Appalachian State
135.67
5
Georgia
Oklahoma
1874.69
Memphis
2065.32
123.61
Michigan
158
Baylor
193.15
Boise State
135.67
6
Oregon
Appalachian State
1812.39
Penn State
1998.85
127.77
Notre Dame
147
Temple
170.61
Memphis
133.89
7
Baylor
Boise State
1807.43
Oregon
1993.69
121.56
Florida
118
Memphis
169.15
Oklahoma
133.89
8
Wisconsin
Oregon
1792.9
Georgia
1991.81
125.32
Navy
115
Texas
151.21
Oregon
107.24
9
Florida
Notre Dame
1780.42
Boise State
1984.68
132.95
Auburn
111
Georgia
142.77
Georgia
105.45
10
Penn State
Georgia
1780.38
Baylor
1983.74
126.03
SMU
100
Oklahoma State
137.5
Utah
101.88
11
Utah
Navy
1768.75
Appalachian State
1982.46
131.68
Oregon
93
Wisconsin
115.14
Baylor
92.95
12
Auburn
Air Force
1762.78
Notre Dame
1968.72
126.07
USC
86
West Virginia
107.35
Minnesota
89.54
13
Alabama
Utah
1750.44
Utah
1961.37
121.67
Utah
81
BYU
104.86
Notre Dame
87.75
14
Michigan
Florida Atlantic
1744.23
Florida
1958.16
132.14
California
79
Oregon
96.24
Alabama
84.18
15
Notre Dame
Penn State
1743.85
Wisconsin
1953.66
122.91
Iowa
76
Georgia Southern
94.09
Air Force
84.18
16
Iowa
Florida
1741.85
Navy
1953.64
127.85
Washington State
75
Auburn
92.22
SMU
84.18
17
Memphis
Wisconsin
1737.6
Michigan
1948.62
124.13
Boise State
70
Cincinnati
91.83
Navy
84.18
18
Minnesota
Baylor
1731.16
SMU
1933.21
132.63
Clemson
67
Michigan
91.63
Penn State
82.39
19
Boise State
Michigan
1728.5
Auburn
1923.82
127.85
Oklahoma
65
Notre Dame
90.47
Florida
80.61
20
Appalachain State
Iowa
1723.57
Air Force
1919.14
127.61
Indiana
61
Penn State
88.92
UCF
73.62
21
Cincinnati
Auburn
1722.53
Minnesota
1912.2
133.86
Air Force
58
Appalachian State
85.11
San Diego State
70.04
22
USC
SMU
1706.03
Alabama
1905.39
135.89
Nebraska
57
Minnesota
84.58
Louisiana
69.89
23
Navy
Cincinnati
1705.69
Iowa
1900.24
126.42
Temple
49
South Carolina
79.94
Florida Atlantic
69.89
24
Virginia
USC
1694.15
Cincinnati
1892.5
121.71
Baylor
48
Iowa
78.57
Louisiana Tech
68.26
25
Oklahoma State
Alabama
1688.82
USC
1859.68
118.26
Stanford
47
Florida
77.77
Wisconsin
66.31
The 2020-2021 Season
The tables below show the rating results for each system at the conclusion of the 2020/2021 college football
regular season. The RMSE numbers as calculated as previously described. Although the program generates a rating and ranking for > 200 college Div. 1 football teams, only the top 25 from the
committee and for each system are shown in the table.
Note: In 2020/2021, with Covid-19 forcing many conferences to only play against teams within the conference, the graph-based rating systems suffered. For example, the BeatGraph approach purposefully discards some results
in an attempt to create an acyclic graph. As a result, despite Alabama having a perfect score in the SEC, some results were discarded and they were ranked lower
than others who simply played teams outside of their conference. Another challenge for the rating systems in the 2020/2021 season was that many
teams did not play the same number of games, which is crucial when the regular season is only about a dozen games to begin with.
Table 5: RMSE vs. Playoff Selection Committee Rankings for Each Model (2020-21)
Elo
Glicko 2
BG
PageRank
HITS
11.69
11.02
43.71
19.52
9.84
Table 6: College Football 2020-2021 Season (Regular Season Only)
In this section, I describe the models I used to predict the winner of the NCAA College D1 football games.
I used the R programming language and machine learning to build models based on classification algorithms described at cran.r-project.org .
The algorithms classify (predict) games not yet played as either a home team victory or an away team victory. I use 4937 past games between season 2010 to 2020 for training
and a different set of 670 past games over the same years for testing. For now, I build each model using data for the following variables:
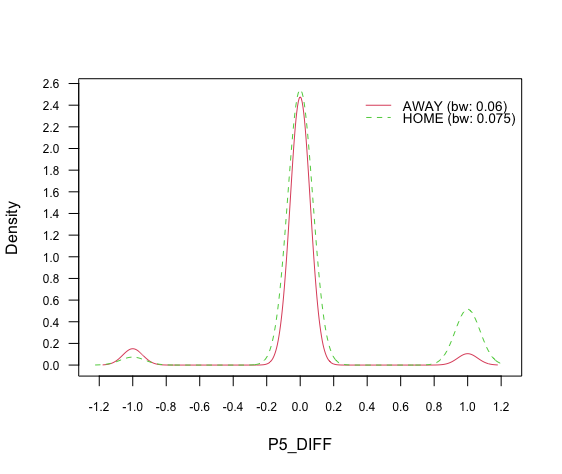
P5_DIFF: "0" If both or no teams are in a Power 5 conf. "1" if only the home team is in P5. "-1" if only the away team is in P5.
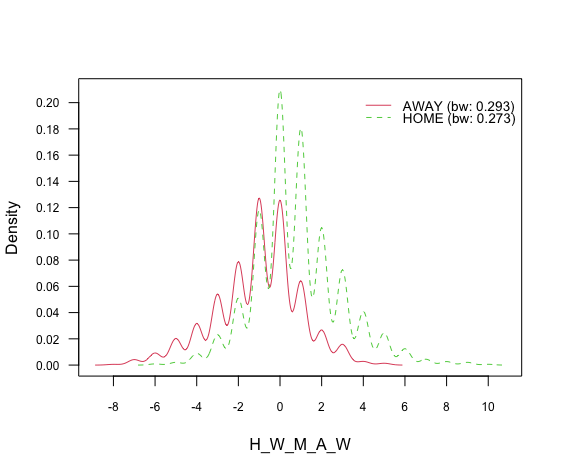
H_W_M_A_W: (# of games the home team has won this season) - (# of games the away team has won this season)
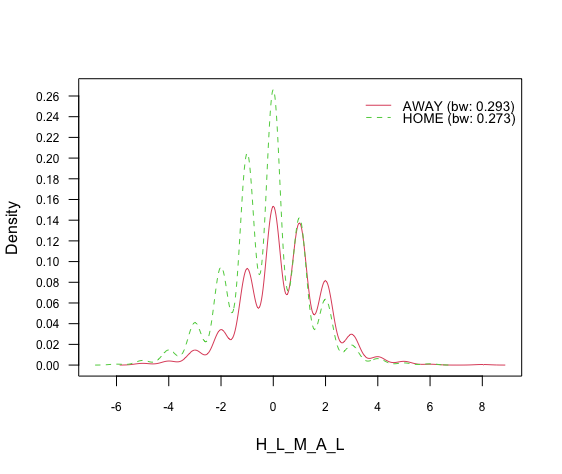
H_L_M_A_L: (# of games the home team has lost this season) - (# of games the away team has lost this season)
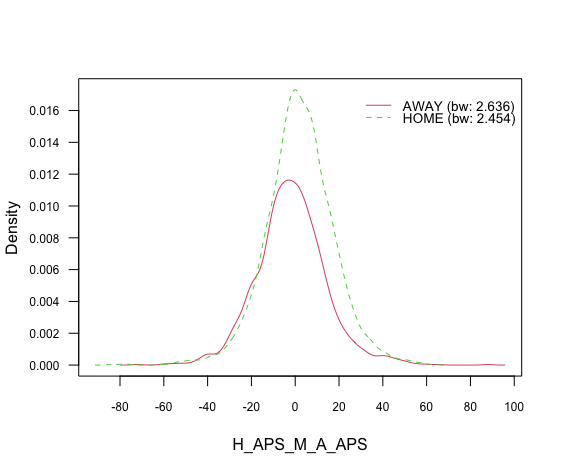
H_APS_M_A_APS: (Avg. # of points the home team scored this season) - (Avg. # of points the away team scored this season)
H_APLI_M_A_APLI: (Avg. # of points the home team conceded this season) - (Avg. # of points the away team conceded this season)
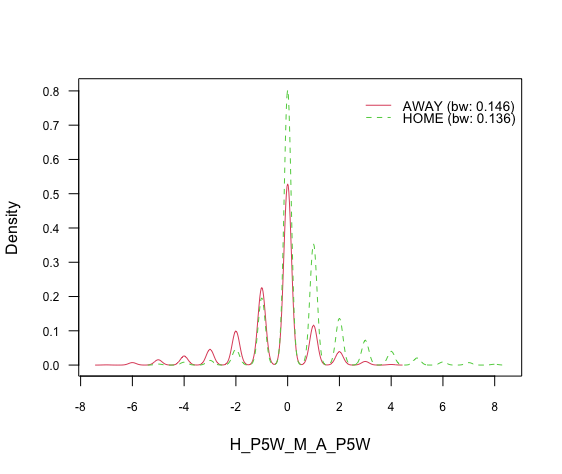
H_P5W_M_A_P5W: (# of P5 teams the home team has beaten this season) - (# of P5 teams the away team has beaten this season)
Random Forest:
Random Forest is a machine learning method that constructs many decision trees at training time as described here .
I use the R programming language to build a model based on the ‘randomForest’ package described here .
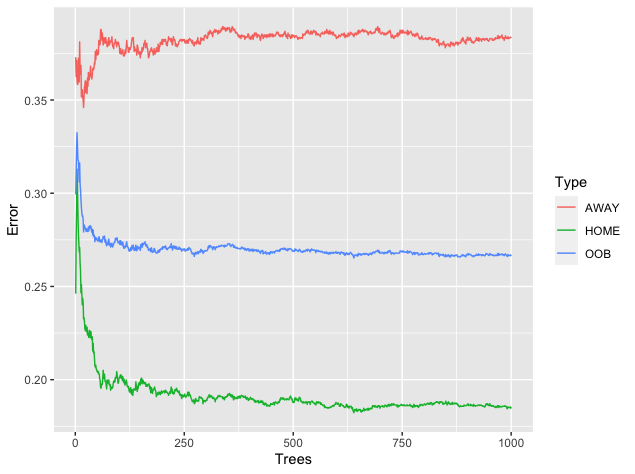
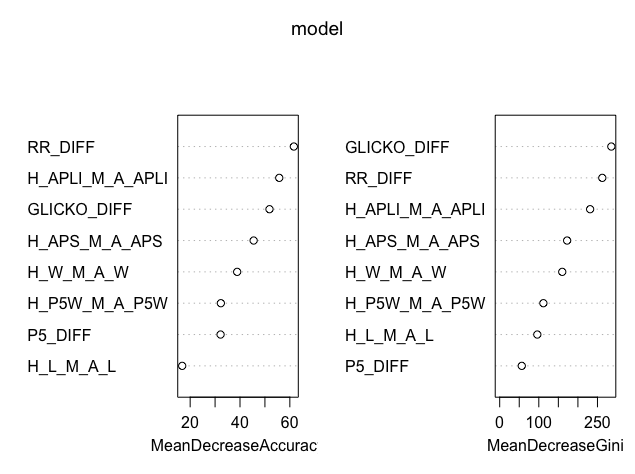
As shown in Figure 2 on the left side, for our test runs, the "out of bag" error converges to about 26% error rate (blue line) overall with a lower error rate when
it predicts a home victory (~18%) and a higher error rate when it predicts an away victory (38%). Also shown in the figure on the right side is the variable importance plot.
The mean decrease accuracy plot shows how much accuracy the model will lose if the variable is not included, higher values indicate the most important variables. The mean decrease in gini plot
shows how much each variable contributes to the homogeneity of the trees in the model, higher values indicate the most important variables.
Figure 2: Error Rate, Variable Importance and Decrease in Gini for Random Forest Example
Support Vector Machines (SVM):
A Support Vector Machine is a supervised machine learning algorithm. In my case, I use it for classification purposes where the SVMs attempt to find a
hyperplane that best divides the dataset into two classes. More details on SVMs can be found here
I use the R programming langauge to build a model based on the ‘e1071’ package described here .
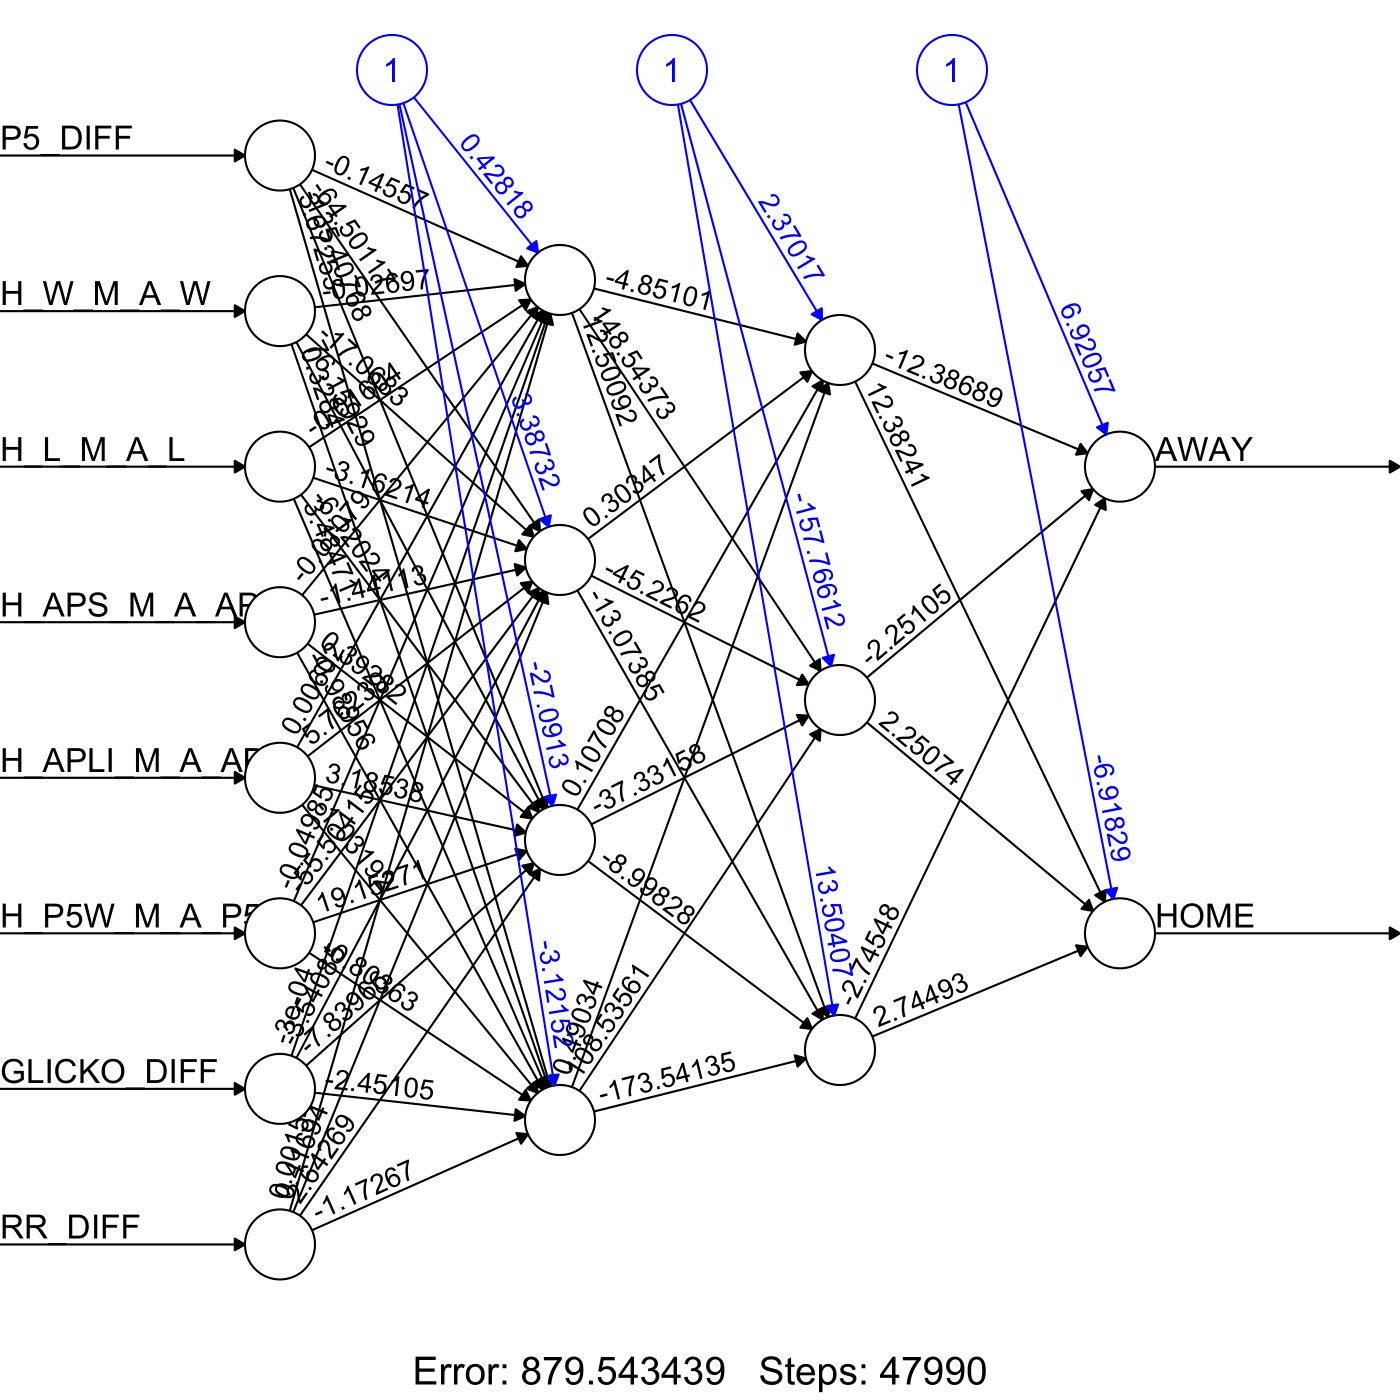
Neural Net:
An artificial Neural Network is a machine learning model inspired by the neural networks in the brain. In our case, the first hidden layer has four neurons and the second hidden layer has three neurons.
The figure below shows an example of the Neural Network results from one of my runs. More details on a Neural Net can be found here
I use the R programming language to build a model based on the ‘neural net’ package described here .
Figure 3: An Example of a Neural Network using Our Variables and Test Data
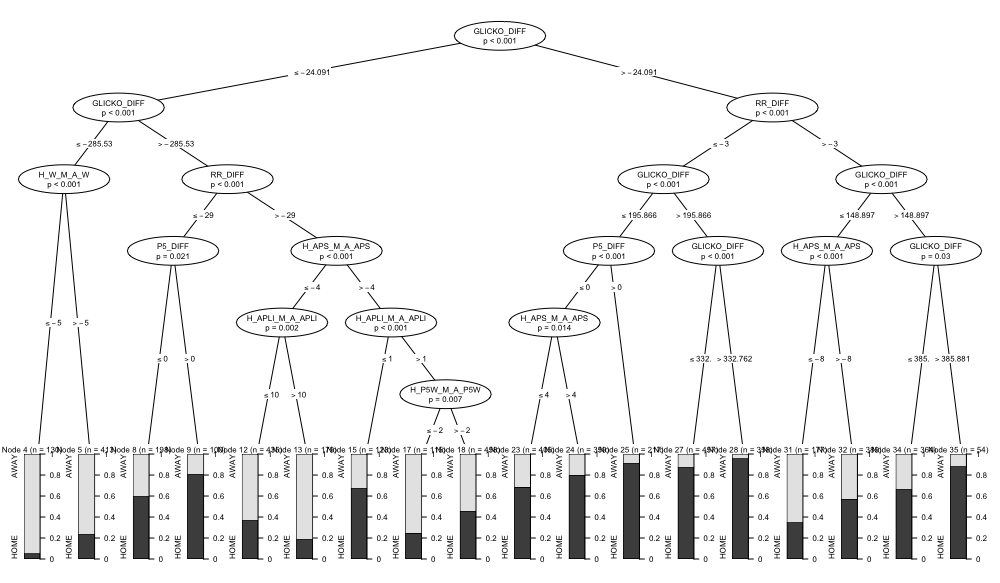
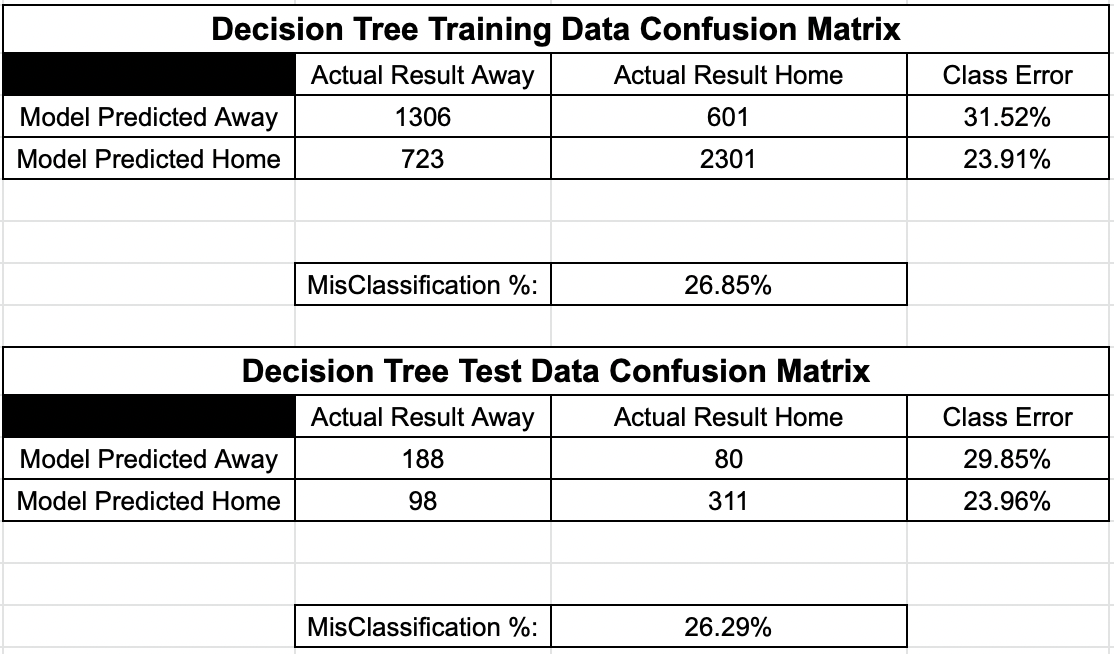
Decision Tree:
The decision tree is a predictive model that we use to build a classification tree based on our variables.
As shown in th figure below, each node represents an "if-else" statement that can be followed to determine whether the decision tree predicts a home or away win.
More details on decision trees can be found here
I use the R programming language to build a model based on the ‘partykit’ package described here .
Figure 4: An Example of a Decision Tree using Our Variables and Test Data
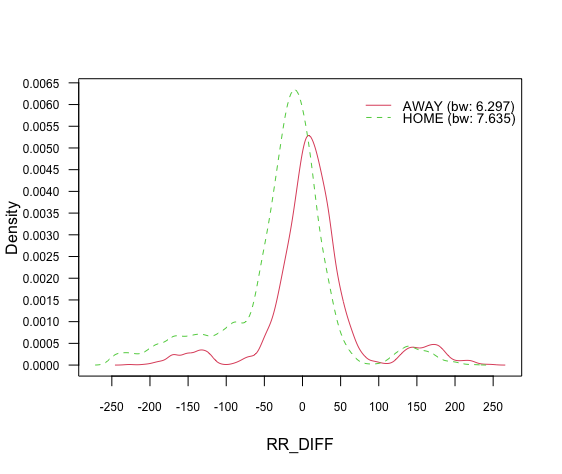
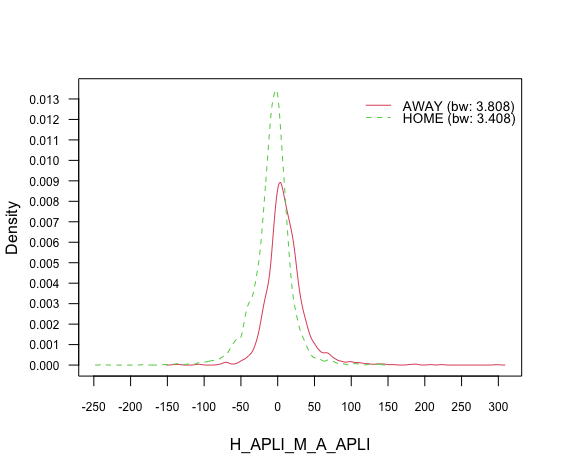
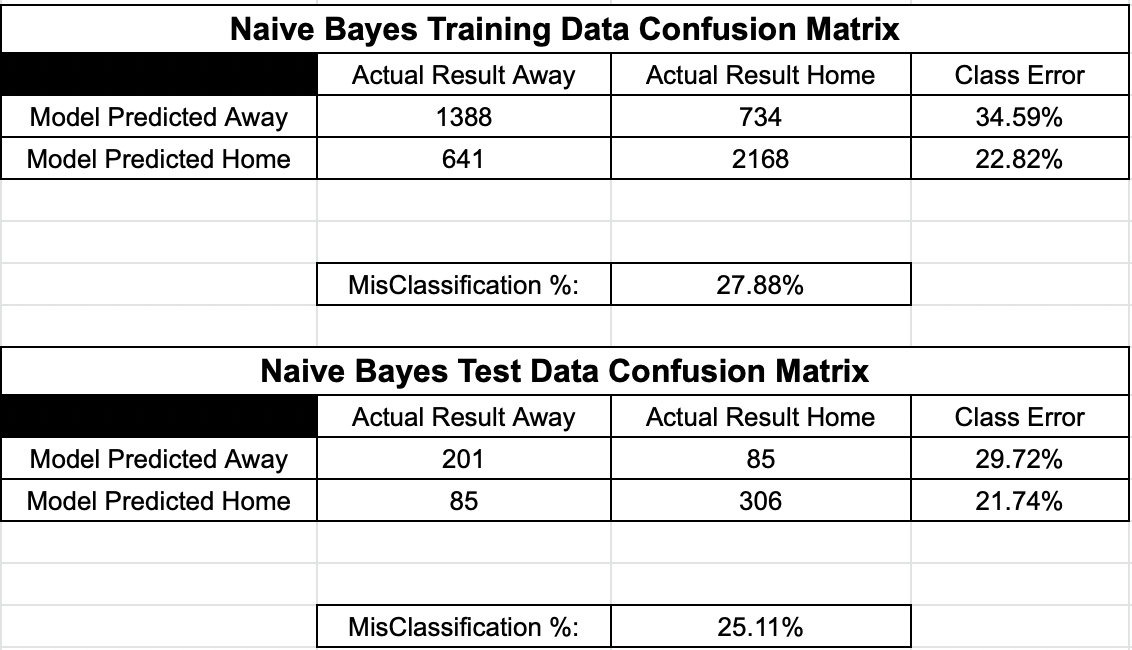
Naive Bayes:
A Naive Bayes classifier is a probablistic machine learning model that is using for classification tasks based on the Bayes theorem.
More details on Naive Bayes can be found here .
I use the R programming language to build a model based on the ‘naivebayes’ package described here .
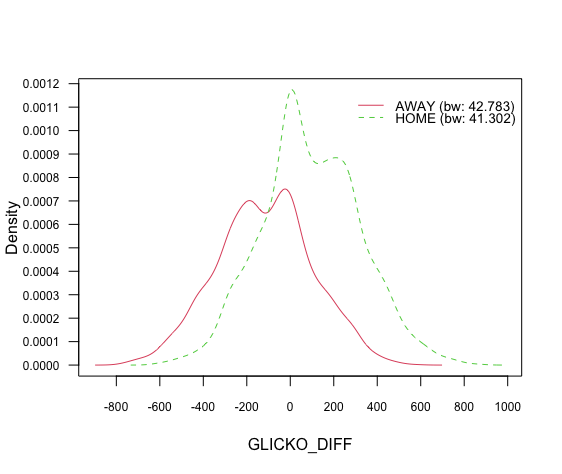
The figures below show a probability density plot for each variable used in the model.
Figure 5: Naive Bayes Probability Density Plots
k-Nearest Neighbor (k-NN):
k-NN is a non-parametric classification method. Since we are solving a classification problem we are using k-NN classification and the output is either "away" or "home".
An object is classified based on the class most common among its "k" nearest neighbors where "k" is a small positive integer. More details can be found
here I use the R programming language to build a model based on the ‘class’ package described
here .
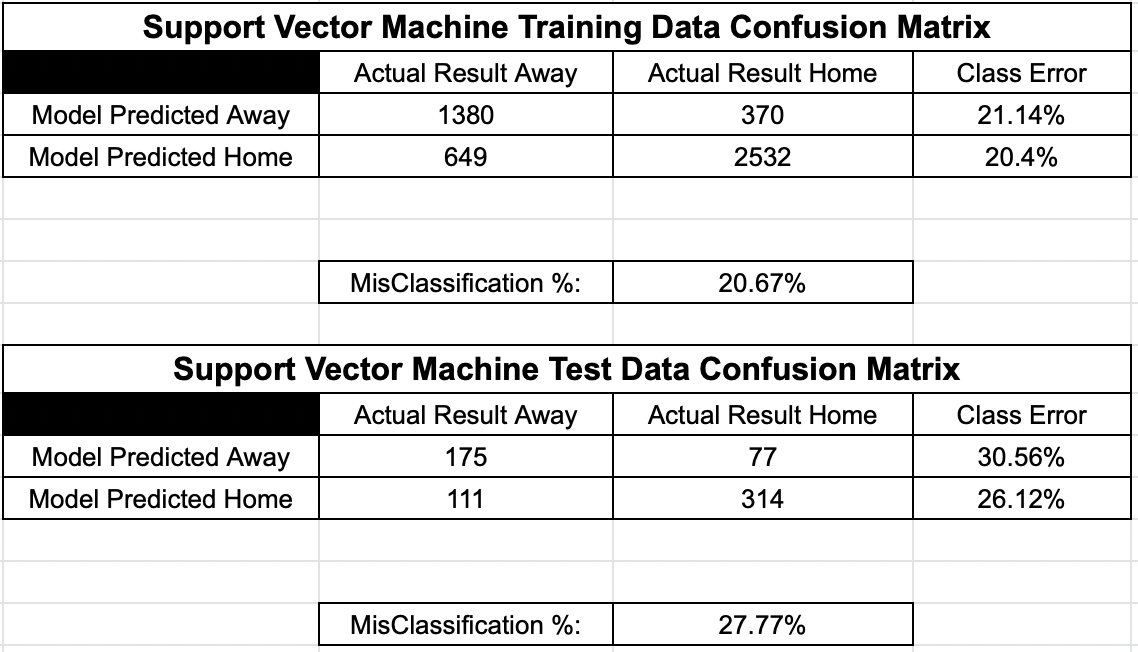
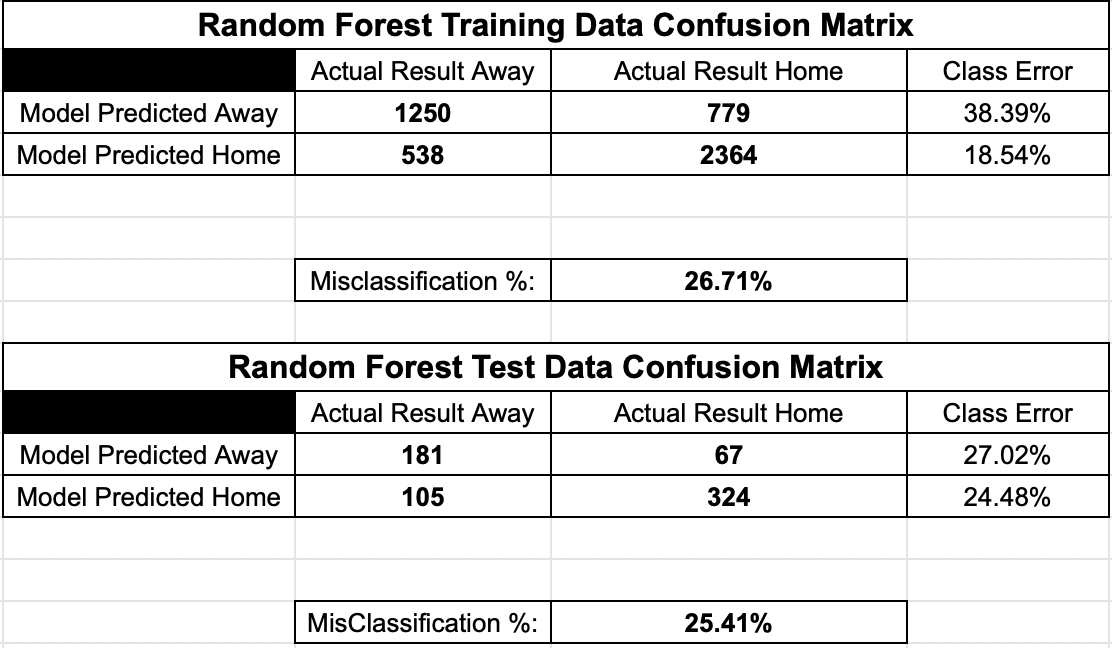
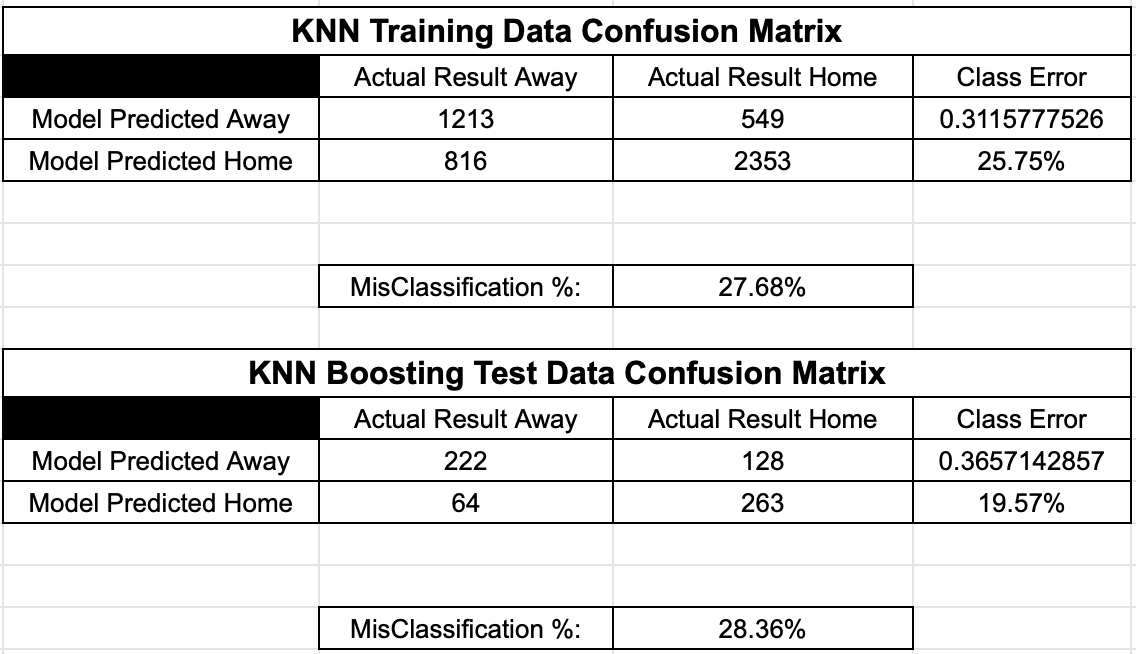
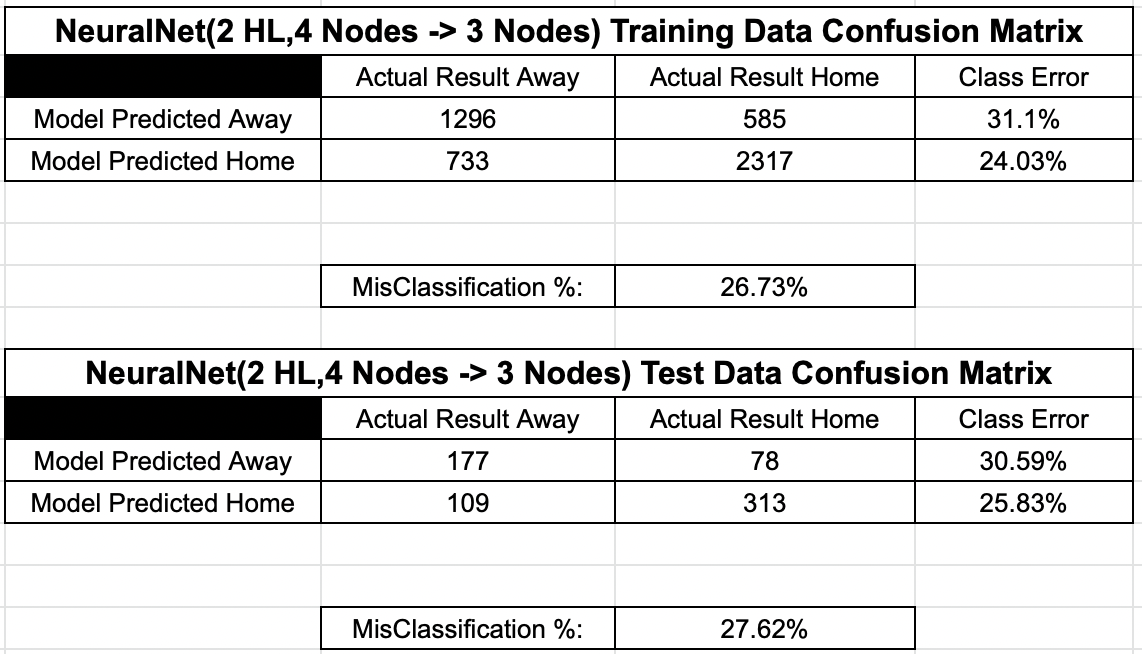
Game Prediction Training and Test Results
In this section, I summarize the training and test results for each machine learning model we just described. As noted before, I used 4937 past games from seasons 2010 to 2020
for training and a different set of 670 past games in the same years for testing. The figures below show the confusion matrix and misclassification % for the training and test data.
In the matrix the upper left and lower right quadrants represent where the prediction matched the result for each model while the opposite quadrants represent where the prediction did not.
Figure 6: Confusion Matrix Each Algorithm using Training and Test Data
For these game predictions, I extracted 10 years of previous NCAA D1 football game results and use the R programming language and machine learning to build models
based on classification algorithms (Random Forest, SVM, Neural Net, Decision Tree, Naive Bayes and k-NN) described at cran.r-project.org .
The algorithms classify (predict) games not yet played as either a home team victory or an away team victory.
Please contact me if you want to learn more about some other projects I have completed, such as:
Weather App
Extracts and interprets raw weather model data from the
internet to give weather forecasts for anywhere in the Contential United States. The weather models currently scraped are: NAM,NAMNEST,HRRR,GFS, and RAP. The program specializes in determining whether there is a severe weather
threat for a specific area, but also provides a basic forecast including: temperature, precipitation amount, visibility, and many other.
SportsDataExtractor
Extracts data from internet for all major and collegiate sports in the USA.
Once the data is extracted it is transformed into an easily readable csv file.
Project-5-8-teamalpha
Enables users to input musical notes using a GUI to create music.
Hytek-File-Reader
Reads hytek files from USA Swimming meets and generates an easy
to read visualizations of the data.